Retail Shelf Audit Checklist: What CPG Brands Should Check in Every Store
A product can reach a retail store and still be difficult for shoppers to find or buy. The shelf may be running low. Packaging may be turned away from the aisle. A price label may belong to a different size, or a promotional display may be missing the product it was meant to feature.
A retail shelf audit gives CPG teams a documented view of those conditions. It helps brand managers, category managers, and retail operations leaders answer a practical question: is our product available, correctly presented, and supported by the right shelf information?
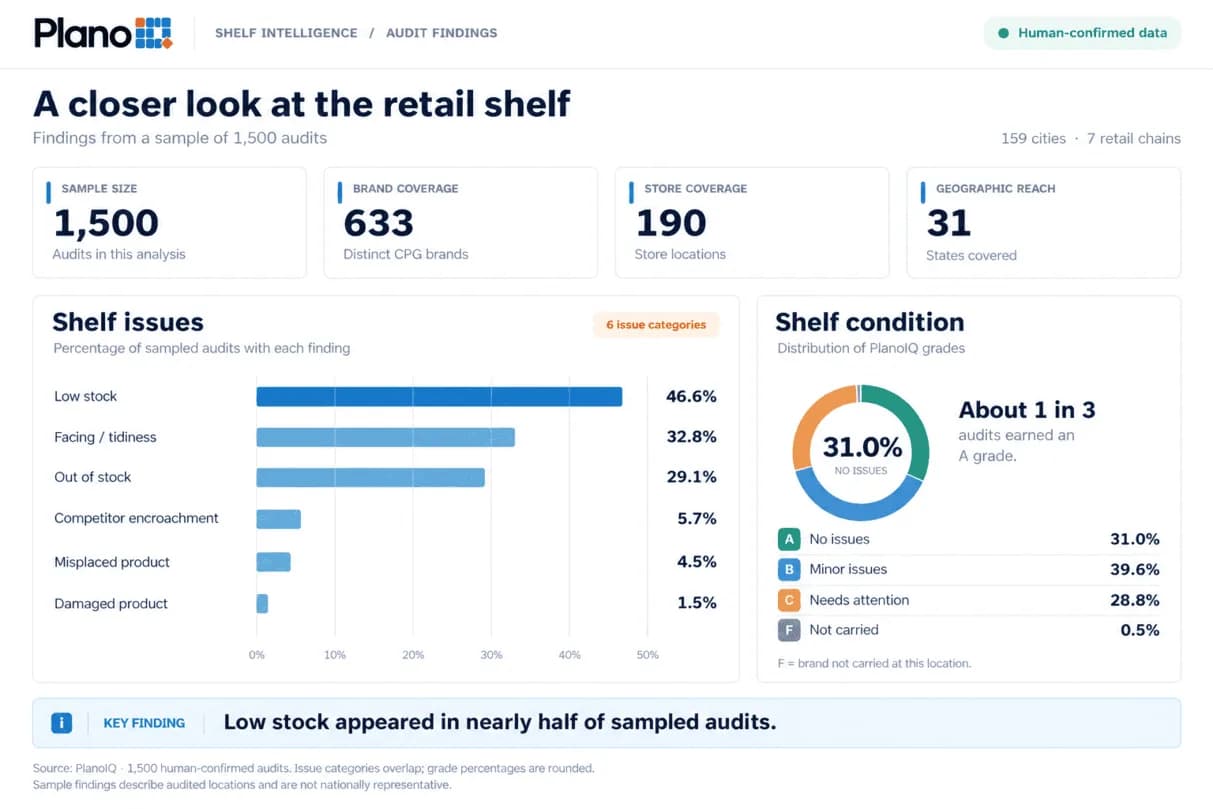
For this analysis, we used a sample of 1,500 human-confirmed shelf audits to assess product availability, presentation, and shelf execution.
Within this sample, only 31.0% received an A grade, meaning no issues were recorded under PlanoIQ’s grading framework. Low stock appeared in 46.6% of audits, facing or tidiness problems in 32.8%, and out-of-stock issues in 29.1%.
The sample provides a view of the audited shelves, not all U.S. retail shelves. A useful audit needs to check more than whether a brand appears somewhere in a photo.
What is a retail shelf audit?
A retail shelf audit is a structured check of a product’s availability and presentation at a particular store and time. It records the conditions visible during the visit and compares them with the expected assortment, placement, pricing, or promotion details available to the auditor.
The output should connect each finding to evidence: the correct store, the relevant product and placement, a dated photo, and a clear description of the issue.
A shelf audit is also a snapshot. It does not establish how long a problem has existed, what caused it, or whether inventory is available in a stockroom unless those points are separately verified.
The retail shelf audit checklist
Use this checklist to define the visit before an auditor enters the store. Provide the target products, expected placements, reference photos or planograms, and current pricing and promotion details wherever available.
Check | What to verify | Evidence to capture |
|---|---|---|
Store and visit details | Correct location, visit date, and shelf section | Store metadata and capture date |
Product and SKU identity | Correct variant, size, format, and pack count | Readable product packaging and shelf label |
On-shelf availability | Target products present; expected slots checked | Wide shelf photo and close-ups of gaps |
Low stock | Visible gaps or sparse product in the facing row | Photos showing the affected shelf section |
Facing and presentation | Products upright, visible, tidy, and facing the shopper | Front-facing photos of the brand block |
Placement and shelf space | Actual position and facings compared with the reference | Shelf photo plus planogram or placement brief |
Pricing and signage | Correct label, expected price, and sale status | Readable shelf labels linked to the correct SKU |
Promotional execution | Expected display, product, price, and signage present | Photos of each promotional placement |
Packaging condition | Visible damage affecting presentation | Close-up of affected packaging |
Follow-up | Issue owner, requested action, and verification plan | Report entry and subsequent evidence |
1. Confirm the store, placement, and product
An accurate observation attached to the wrong location or SKU is difficult to act on. Begin with the store’s chain, address, geographic coordinates, and capture date. Identify whether the photo shows the main shelf, an endcap, or another placement.
Then confirm the product. Similar packaging can hide differences in flavor, size, formulation, or pack count. Finding one variant does not establish that the full expected assortment is available.
Compare readable packaging and shelf labels with the campaign’s product list. If a photo cannot support an exact SKU identification, mark it for verification rather than treating the brand’s presence as proof.
2. Check availability at every expected placement
Look for the target products and any empty slots where they are expected to sit. Record which products are visible, which expected positions are empty, and which placements could not be verified.
In PlanoIQ’s sample, 29.1% of confirmed audits contained an out-of-stock finding. That is the share of audits containing the issue, not the percentage of every SKU in those stores that was unavailable.
Keep the conclusion within the evidence. A product missing from the photographed section may be elsewhere in the store. An empty shelf also does not establish phantom inventory: that requires comparing recorded inventory with verified physical stock.
If the campaign includes both a main shelf and a promotional display, inspect and report on each separately.
3. Record low stock before the shelf is empty
Low stock was the most frequently recorded issue in PlanoIQ’s sample, appearing in 46.6% of confirmed audits.
Look for gaps across the facing row and visibly sparse product presentation. Record the affected product and position so the brand or retail partner knows where to investigate.
A front-facing photo cannot reliably reveal all units behind the visible products. Describe observable conditions without inventing an inventory count or predicting when the shelf will run out.
Repeated visits can help distinguish an isolated observation from a recurring problem at the same location.
4. Assess facing, tidiness, and visibility
A product can be present but poorly presented. Check whether packages face the aisle, stand upright, and form a clear, orderly brand block. Note leaning products, turned packaging, and items that obscure the target product.
Facing or tidiness problems appeared in 32.8% of PlanoIQ’s confirmed audits.
Capture enough context to show the condition clearly. A close-up may identify the affected package, while a wider photo shows how it sits within the shelf section.
5. Compare placement and facings with the expected layout
Where a planogram or placement brief is available, compare the actual shelf with that reference. Check the shelf level, relative position, expected assortment, and allocated facings.
Record misplaced products and possible competitor encroachment. In PlanoIQ’s sample, competitor encroachment appeared in 5.7% of audits and misplaced products in 4.5%.
Competitor products beside a brand are not automatically an issue. To establish that they occupy the brand’s allocated space, use the expected layout, shelf labels, or other supporting evidence. Without a reliable reference, document the observed placement and request confirmation.
6. Verify shelf prices and sale status
Match the shelf label to the product before comparing prices. Check the variant, size, and pack count, then record the observed price against the campaign’s expected price.
PlanoIQ’s product-check campaigns distinguish an exact price match from an observed price above or below the expected value. They also check whether the observed promotional or sale state matches the expectation.
Keep price and promotion findings separate. A readable price can match while an expected sale sign is missing. A sale sign can also be present without indicating a problem; PlanoIQ treats its presence as an informational tag.
If the label is unreadable, request better evidence. Shelf signage alone does not verify the price charged at checkout.
7. Check promotional placements independently
Use the promotion brief to establish what should be present on the visit date. Verify the display location, target products, signage, and advertised price against those expectations.
A healthy main shelf does not establish that an endcap is correctly executed. A promotional display can have missing products or unclear signage even when the primary shelf looks good.
Report each placement separately. PlanoIQ supports per-placement grades, allowing the main shelf and an endcap from the same visit to receive different assessments.
8. Document visible packaging damage
Look for visibly crushed, torn, or otherwise damaged packaging and capture a close-up that supports the finding. Damaged products appeared in 1.5% of PlanoIQ’s confirmed audits.
Describe what is visible. Do not infer internal product quality, safety, or the cause of damage from an exterior photograph.
Turn the checklist into an actionable report
The report should make it easy for someone who did not visit the store to understand the issue and locate it.
For each finding, include the affected product or brand region, shelf position, annotated photo, issue description, and relevant field notes. Preserve the auditor’s notes as written and distinguish observations from explanations that still need confirmation.
PlanoIQ uses the following grading framework:
Grade | Meaning |
|---|---|
A | No issues: fully stocked and well-faced |
B | Minor issue: low stock or a facing problem |
C | Needs attention: out of stock or multiple problems |
F | Not carried — the brand is not carried at this store location. |
An F grade means the location does not carry the brand. It is a distribution status, distinct from an out-of-stock issue involving a product the store is expected to carry. PlanoIQ’s dashboard groups C and F reports as “at risk,” but readers should keep those two conditions separate when interpreting the results. These are PlanoIQ’s operational grades, not a universal industry standard. The supporting photos and findings remain essential for interpreting any grade.
Assign a follow-up owner and define the requested action. Depending on the finding, that might mean asking a retail partner to check replenishment, confirming the intended placement, or clarifying the expected price. Schedule a follow-up check when the issue needs visual confirmation of resolution.
How PlanoIQ verifies shelf findings
PlanoIQ combines field photography, AI analysis, and human review. Auditors photograph the relevant shelf sections and can add verbatim field notes. AI identifies brand regions, and two independent models assess the same shelf crop for stock and presentation issues.
Only findings on which both models agree are automatically included in the draft. Findings raised by just one model remain available to the human reviewer. A trained reviewer confirms or corrects the grade, tags, marked regions, and written assessment before publication.
Brands receive an interactive web report, with an optional PDF, that connects findings to annotated shelf photos. Weekly trends and persistent-issue detection help teams identify recurring conditions across confirmed visits.
Start with a documented view of your shelves
A useful shelf audit leaves your team with a clear record: what was checked, what was observed, what remains uncertain, and what needs follow-up.
Use the checklist to make those checks consistent across locations. Then use the findings to focus conversations with retail partners on specific products, placements, and actions.
Want to see how your products appear in stores? Request a free shelf-visibility report from PlanoIQ.
Data source and methodology: This analysis uses a sample of 1,500 human-confirmed shelf audits, covering 633 distinct CPG brands at 190 store locations across 31 states, 159 cities, and 7 national chains. Multiple issue tags can appear in one audit, so issue percentages should not be added together. Audit counts do not necessarily represent unique stores, shelf sections, or products. The sample is not presented as random or nationally representative. Sample size, percentages, and coverage figures were supplied and confirmed by PlanoIQ.